AdPlexity Mobile Promo Codes - ✅ 100% Verified Deals August 2026
AdPlexity Mobile is an competitive ad intelligence tool with over 14+ million ads in database from over 82 countries, 85 languages, 57 affiliate networks and 5 traffic sources.
Discover golden nuggets from your competitors now
→ View other AdPlexity products.
Today's promotions and deals on AdPlexity Mobile valid from August till September 2026
$399 AdPlexity Mobile Coupon (AdPlexity Mobile Yearly Plan)
yearly discount
Expires
N/A
Click our link to join AdPlexity Mobile, then:
- Opt for yearly billing when checking out
- Choose the AdPlexity Mobile plan
- Submit payment details
- Take $399 off each year with AdPlexity Mobile
Deal Activated, no coupon code required!
Did it work?
Coupon Detail
$399 AdPlexity Mobile Coupon (AdPlexity Mobile Yearly Plan)
Expires: N/A
Submitted: 10 days ago

AdPlexity Mobile In-Depth Review
Welcome to the most in-depth review on AdPlexity Mobile where I explain all the features like search filters, and ad details complete with screenshots.
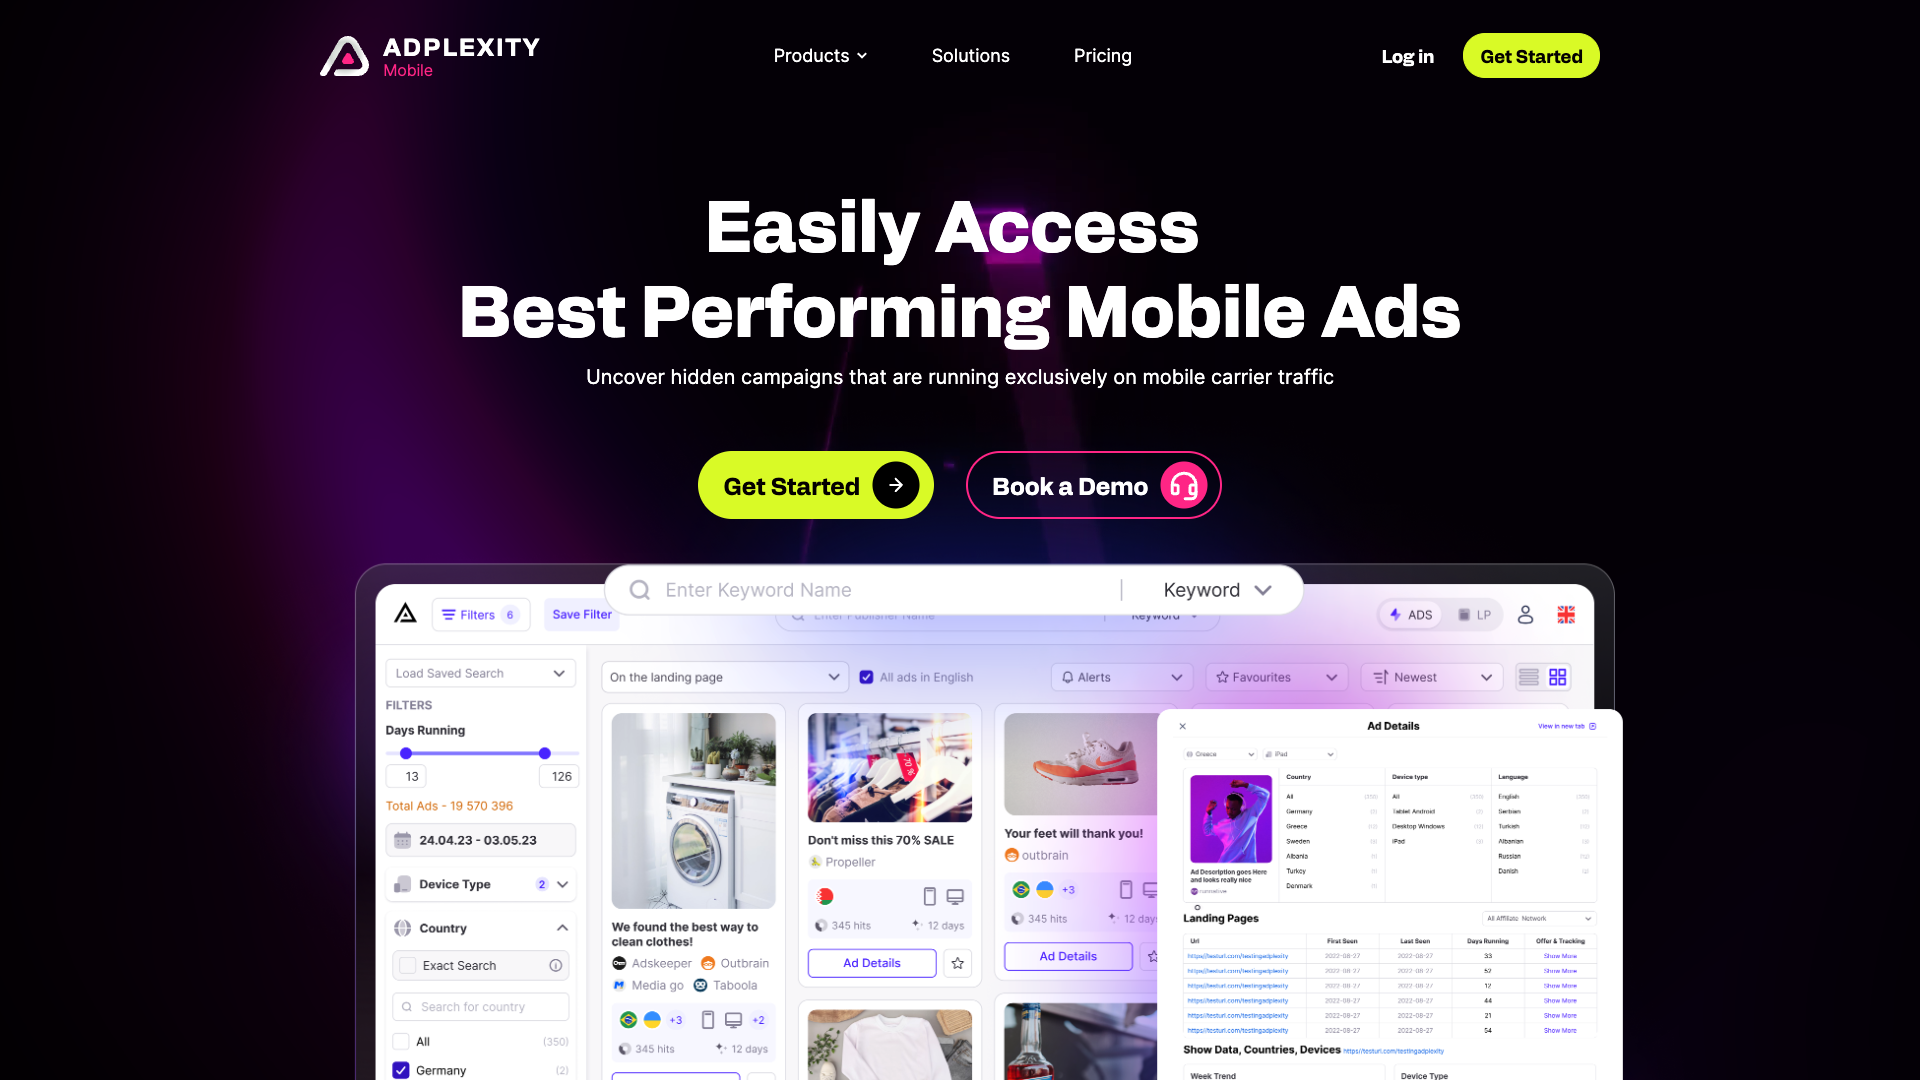
Dashboard
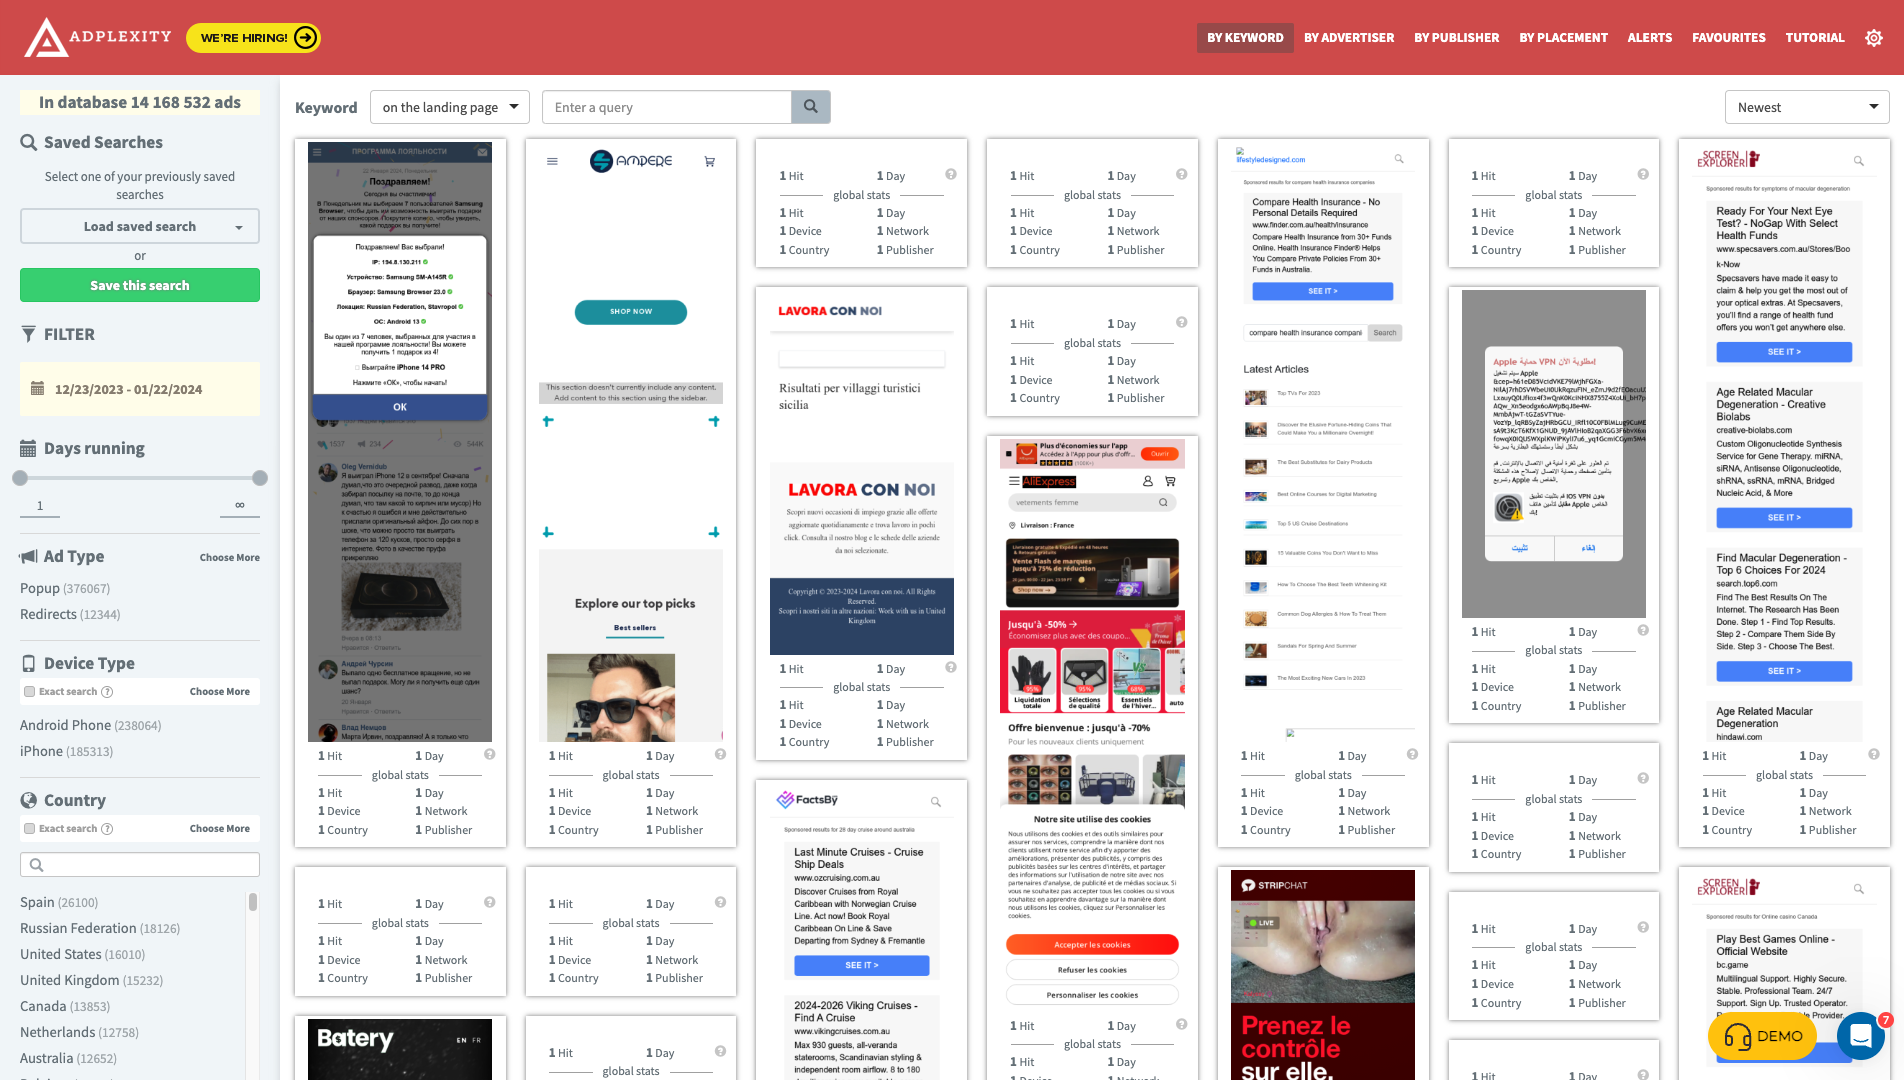
When you first log into your AdPlexity Mobile account, you are greeted with a clean, intuitive dashboard that allows you to easily analyze competitive mobile ads. Across the top navigation bar, you can filter mobile ads in various ways - by keyword, advertiser, publisher, placement, and more.
The main view shows a grid of mobile ad landing page screenshots that you can infinitely scroll through. A keyword filter at the top allows you to search for specific ads. Overall, the dashboard makes it simple to dig into the competitive mobile ad intelligence you need. With endless filtering options and an infinite stream of mobile ad creatives to analyze, you'll uncover competitor ads in no time.
Search Filters
The left sidebar features saved searches and numerous filters to narrow down your results, including ad type, device, country, language, and bid price.
Let's dive deeper into each filter...
Ad Type Filter
One powerful feature in AdPlexity Mobile is the ability to filter by Ad Type, either Mobile Popups or Redirects. This allows you to analyze your competitors' strategies for different verticals. Mobile Popups tend to be used more heavily in verticals like gaming and entertainment where there are engaged mobile users. Analyzing these popup ads can reveal creative approaches for capturing attention. Redirect ads on the other hand point to external sites, so they lend themselves better to direct response verticals like finance and ecommerce. By segmenting your analysis using the Ad Type filter, you can better understand the vertical-specific approaches competitors take. This in turn helps you craft smarter ads tailored to each vertical.
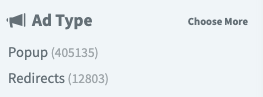
The key is to not treat all mobile ads equally. The Ad Type filter cuts through the noise, letting you compare apples to apples. So pay attention to where competitors focus their Popup vs Redirect ads. Those choices reflect their individual strategies. Use the filtering to inform better targeting, creatives and landing pages.
Device Type Filter
The ability to filter by Device Type in AdPlexity Mobile allows you to gain valuable insights into your competitors' mobile advertising strategies. By analyzing Android Phone and iPhone ads separately, you can identify trends in the types of verticals and consumers targeted on each platform.
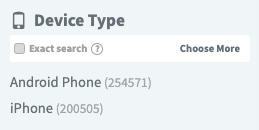
Android users tend to skew towards more price-conscious consumers who are receptive to discounts and promotions. Competitors may run aggressive direct response campaigns promoting sales or lead gen offers on Android. The verticals tend to include retail, personal finance, utilities, and subscription services.
Meanwhile, iPhone ads aim for a more premium audience willing to pay for quality and status. You'll see ads from high-end brands in categories like travel, financial services, luxury retail, and app install campaigns. The creatives focus more on brand building than hard sell offers.
Segmenting your analysis by device type in AdPlexity Mobile allows you to tailor your own mobile campaigns to the distinct user profiles on each platform. You can observe what resonates in competitors' ads and identify untapped opportunities to target. This filter adds an extra dimension to your competitive research.
Country Filter
The Country filter in AdPlexity Mobile allows you to spy on competitor mobile ads in over 80 countries. This gives you a huge advantage in your affiliate marketing efforts. You can analyze what type of mobile ads your competitors are running in multiple geographic locations.
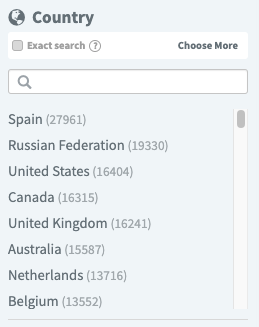
Available country filter options in in AdPlexity Mobile:
| Spain | Russian | United | United |
| Canada | Australia | Netherlands | Belgium |
| Italy | France | Morocco | Brazil |
| Israel | Germany | Poland | Serbia |
| Indonesia | Korea | Switzerland | Sweden |
| Turkey | Czech | Greece | Portugal |
| Argentina | Colombia | Romania | Philippines |
| Thailand | Mexico | Singapore | Peru |
| Nepal | Bangladesh | South | Tunisia |
| Saudi | China | Malaysia | India |
| Ukraine | Norway | Viet | Hong |
| Luxembourg | Egypt | Kenya | Denmark |
| Iraq | Finland | Algeria | Venezuela |
| Japan | Pakistan | Dominican | Taiwan |
| Latvia | Lithuania | Palestine | United |
| Chile | Austria | Bulgaria | Georgia |
| Hungary | Macedonia | Qatar | Zimbabwe |
| Côte | Paraguay | Jordan | Moldova |
| Sri | Bosnia | Guatemala | Cameroon |
| New | Ghana | Nigeria | Ireland |
| Azerbaijan |
For example, you may find that a certain offer converts better in some countries compared to others. Using the Country filter, you can see if your competitors are taking advantage of this knowledge by targeting those countries more aggressively.
You can also discover new affiliate offers that seem to be working well in specific countries but haven't expanded globally yet. By getting in early, you'll have less competition. The Country filter allows you to spot these opportunities before other affiliates.
Overall, the 80+ country filter gives you valuable intelligence on the best converting mobile offers on a geographic basis. Use this to find untapped affiliate potential in markets your competitors are ignoring. This unique feature is a huge leg up for your mobile pops and redirects business.
Language Filter
The Language filter in AdPlexity allows you to see the ads that your competitors are running in specific languages. This can be extremely useful if you want to target audiences who speak a certain language.
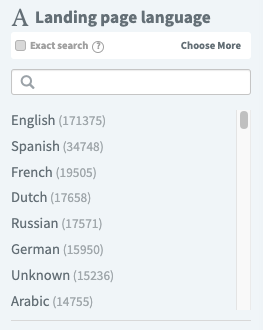
Available language filter options in AdPlexity Mobile:
| English | Spanish | French | Russian |
| Dutch | German | Unknown | Arabic |
| Portuguese | Polish | Italian | Greek |
| Turkish | Korean | Indonesian | Swedish |
| Czech | Thai | Ukrainian | Romanian |
| Hebrew | Danish | Vietnamese | Lithuanian |
| Chinese | Norwegian | Serbian | Chineset |
| Bengali | Finnish | Japanese | Hindi |
| Swahili | Malay | Latvian | Hungarian |
| Urdu | Kazakh | Slovak | Estonian |
| Galician | Catalan | Bulgarian | Bosnian |
| Latin | Punjabi | Basque | Albanian |
| Georgian | Croatian | Sinhalese | Scots |
| Persian | Slovenian | Esperanto | Tagalog |
| Bihari | Tamil | Macedonian | Somali |
| Afar | Irish | Assamese | Marathi |
| Kinyarwanda | Scots | Sanskrit | Welsh |
| Azerbaijani | Corsican | Occitan | Xhosa |
| Nepali | Bislama | Seselwa | Armenian |
| Icelandic | Mauritian | Malagasy | Maori |
| Mongolian | Maltese | Pedi | Shona |
| Turkmen |
For example, if you notice your competitor is running a lot of Spanish language ads, you may want to consider creating Spanish language ads too to reach that demographic. The Language filter makes it easy to analyze the volume of ads in each language and identify opportunities.
You can also use the Language filter to avoid competing directly against your competitors in certain languages. If you see they are dominating in one language, you may want to focus your efforts on different languages where there is less competition. This allows you to efficiently allocate your ad budget to the areas of least resistance.
Keep a close eye on the Language filter to gauge where your competitors are directing their efforts. You can then capitalize on areas they are missing to successfully reach untapped audiences. This kind of competitive insight is invaluable and can greatly boost the performance of your mobile ad campaigns.
Affiliate Network Filter
The Affiliate Network filter in AdPlexity is super useful if you're an affiliate marketer. It lets you see what offers your competitors are running on different affiliate networks.
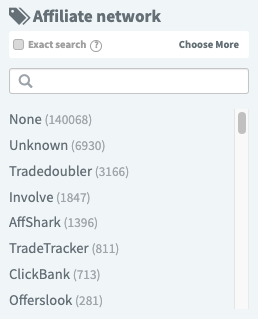
Available affiliate network filter options in AdPlexity Mobile:
| None | Unknown | Tradedoubler | Involve |
| AffShark | TradeTracker | ClickBank | Offerslook |
| AvantLink | Admitad | NordVPN | CJ |
| DepositPhotos | BuzzCreators | Golden | Soicos |
| Luna | ClickDealer | Scaleo | Fluent |
| Alibaba | Little | Max | CrakRevenue |
| G | Cryptocoinsad | Surfshark | Meridianbet |
| Insparx | Adstrategy | MOBIPIUM | Big |
| DAO | CPA | VortexAds | Affiliate |
| Cyber | Mobvista | Gotzha | Mobidea |
| CasinoRewards | Roiandco | AdStart | Sparklemob |
| MaxWeb | Prospect | YeahMobi | Offeriz |
| BuyGoods | SendT | CPAGrip | Plarium |
| Accesstrade | Everflow | Amateur.tv | Ceneo |
| Atlas VPN |
For example, you can filter by Network, then search for offers in your niche. This shows you the top offers other affiliates are promoting and making money with.
Knowing this helps in a couple big ways. First, it gives you new potential offers to promote that are proven to convert. Just make sure you're allowed to promote them too.
Second, seeing what offers competitors run allows you to one-up them. Find an offer targeting the same audience but with higher payouts or better creatives. Promoting better offers is how you stand out and beat your competition.
The Affiliate Network filter cuts down on guesswork. You instantly spot opportunities to promote relevant offers your audience responds to. Use it to stay on top of the latest and most profitable affiliate programs in your market.
Traffic Source Filter
The Traffic Source filter in AdPlexity allows you to see which traffic sources your competitors are using to drive traffic to their offers. This can be really useful competitive intelligence.
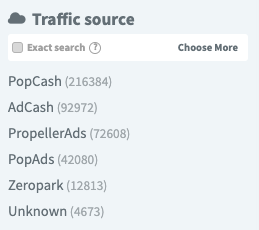
Available traffic source filter options in AdPlexity Mobile:
| PopCash | AdCash | PropellerAds | PopAds |
| Zeropark |
For example, you may find that a lot of your competitors are using PopCash or PropellerAds. This signals that these traffic sources could be good ones to test out yourself. On the flip side, if you see hardly any of your competitors using a source like Zeropark, that might indicate it's not as profitable for that offer type or vertical.
I'd recommend applying the Traffic Source filter and taking note of the top sources used. Try to spot any patterns or common sources across competitors. Then you can test out running similar traffic to see if you can replicate or outperform their results. This ultimately allows you to make more informed decisions about which traffic sources to focus your ad budget on.
Using the filter this way takes a lot of the guesswork out of the equation. You're letting your competitors' actions show you the best traffic sources to leverage. It's a smart way to gain an edge.
Tracking Tool Filter
The Tracking Tool filter allows you to see which ad tracking platforms are most popular among affiliate marketers. You can select from over a dozen options like Thrive, Voluum, BeMob, Binom, and more.
![]()
Available tracking tool options in AdPlexity Mobile:
| Thrive | Voluum | BeMob | Binom |
| Peerclick | Redtrack | AdsBridge | iMobiTrax |
| FunnelFlux | CPV | Link | Prosper202 |
The ranking of the top tracking tools differs depending on the traffic type. For example, with native traffic you may see a different top 5 than you would for pop traffic. The rankings also change over time as tracking tools update their features and pricing.
For instance, Binom and Voluum used to dominate the top spots. But now you see Thrive coming out on top more often because they introduced an affordable cloud-based plan. Voluum still leads for some verticals thanks to their robust analytics.
It's interesting to check the Tracking Tool filter every few months to see which solutions affiliates prefer. The mix of free tools versus paid tools in the top 10 seems to change with each update. Monitoring these trends can help you select the best tracking platform as an affiliate.
Arbitrage Network Filter
| Sedo | Tonic | DomainActive | System1 |
| Bodis |
Connection Filter
You can target very specific mobile ad campaigns in AdPlexity by using the Connection (ISP/Carrier) filter. This lets you see the ads being run by over 100 different mobile carriers and internet service providers. So for example, you could filter to only see ads on Verizon's network. Or only ads running through T-Mobile's service. This gives you laser targeting.
You can discover competitors just on one carrier. Or find out what type of mobile ads work best on a certain carrier by analyzing the top ads. The Connection filter combined with the other filters in AdPlexity really allows you to slice and dice the data. You can zero in on what's working in mobile ads on any carrier or ISP. This helps you make smarter decisions in your own campaigns.
Bid Price Filter
One powerful feature of AdPlexity Mobile is the ability to see the bid price for competitor mobile ads. This allows you to gauge demand and profitability potential. Ads with higher cost-per-click (CPC) bids typically mean the advertiser has optimized the campaign for high conversion rates.
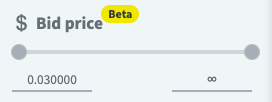
By analyzing ads with bid prices at the higher end of the range, you can conclude that the offer, landing page and overall funnel must be converting profitably. Otherwise, the advertiser would not be able to justify such high bids. This means that targeting similar demographics and verticals could yield strong results for your campaigns as well.
Essentially, bid prices act as a heat map, pointing you to the most lucrative opportunities. By reverse engineering and modeling what the top bidding advertisers are doing right, you can shortcut your way to success. Spend time studying those high bid competitor ads and you're likely to unlock breakthroughs for your own efforts.
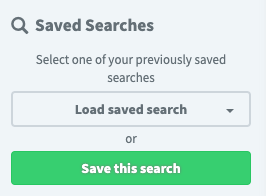
Saved Searches
Ad Details Page
Clicking on "Show More" will show a lightbox with more details:
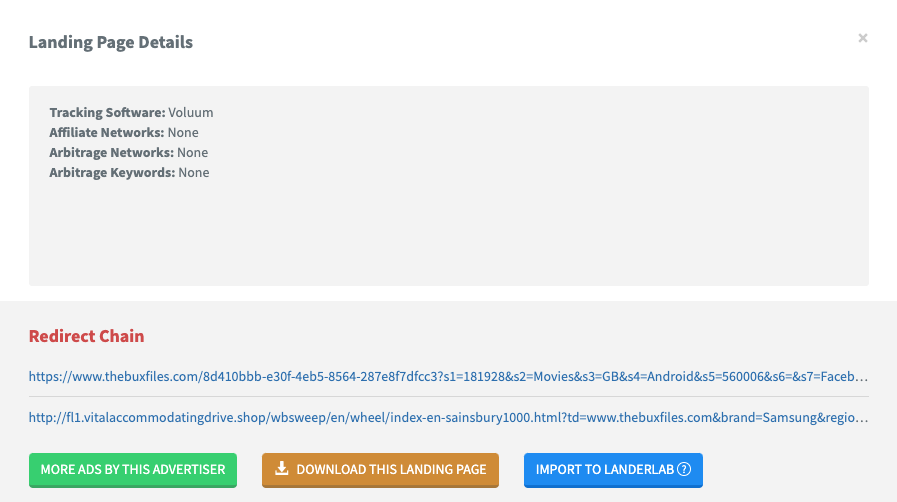
- Tracking Software
- Affiliate Networks
- Arbitrage Networks
- Arbitrage Keywords
- Redirect Chain
- Action Buttons
- More ads by this advertiser
- Download this landing page
- Import to Landerlab
On the rest of the page you will see the following 10 widgets with tons of data:
- Ad Trend
- Bid History
- Week Trend
- Device Type
- Publishers By Duration
- Publishers By Volume
- Publisher Placement IDs By Duration
- Publisher Placement IDs By Volume
- Traffic Sources By Duration
- Traffic Sources By Volume
Let's have a look at each widget individually....
Ad Trend
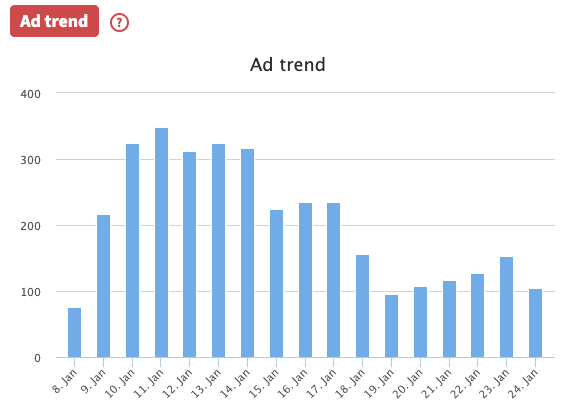
The ad trend bar chart widget is a useful tool for tracking the number of times your competitors' ads appear over time. The chart has a simple format that is easy to interpret - the x-axis shows the days in the selected date range, while the y-axis displays the frequency of ad occurrences.
This visual representation allows you to quickly identify positive and negative trends. Spikes in ad activity likely indicate your competitor is testing or ramping up campaigns, which could be an opportunity for you to assess their targeting and creatives. On the flip side, downward trends may signify reduced competition in certain areas that you can capitalize on.
Checking the ad trend bar chart regularly ensures you stay on top of the competitive landscape. You can use it to find openings to outbid competitors, mimic high-performing creatives, or simply monitor ongoing tests. The time component adds a strategic planning element - you can not only see your competitor's current strategies, but track how their campaigns evolve week-by-week.
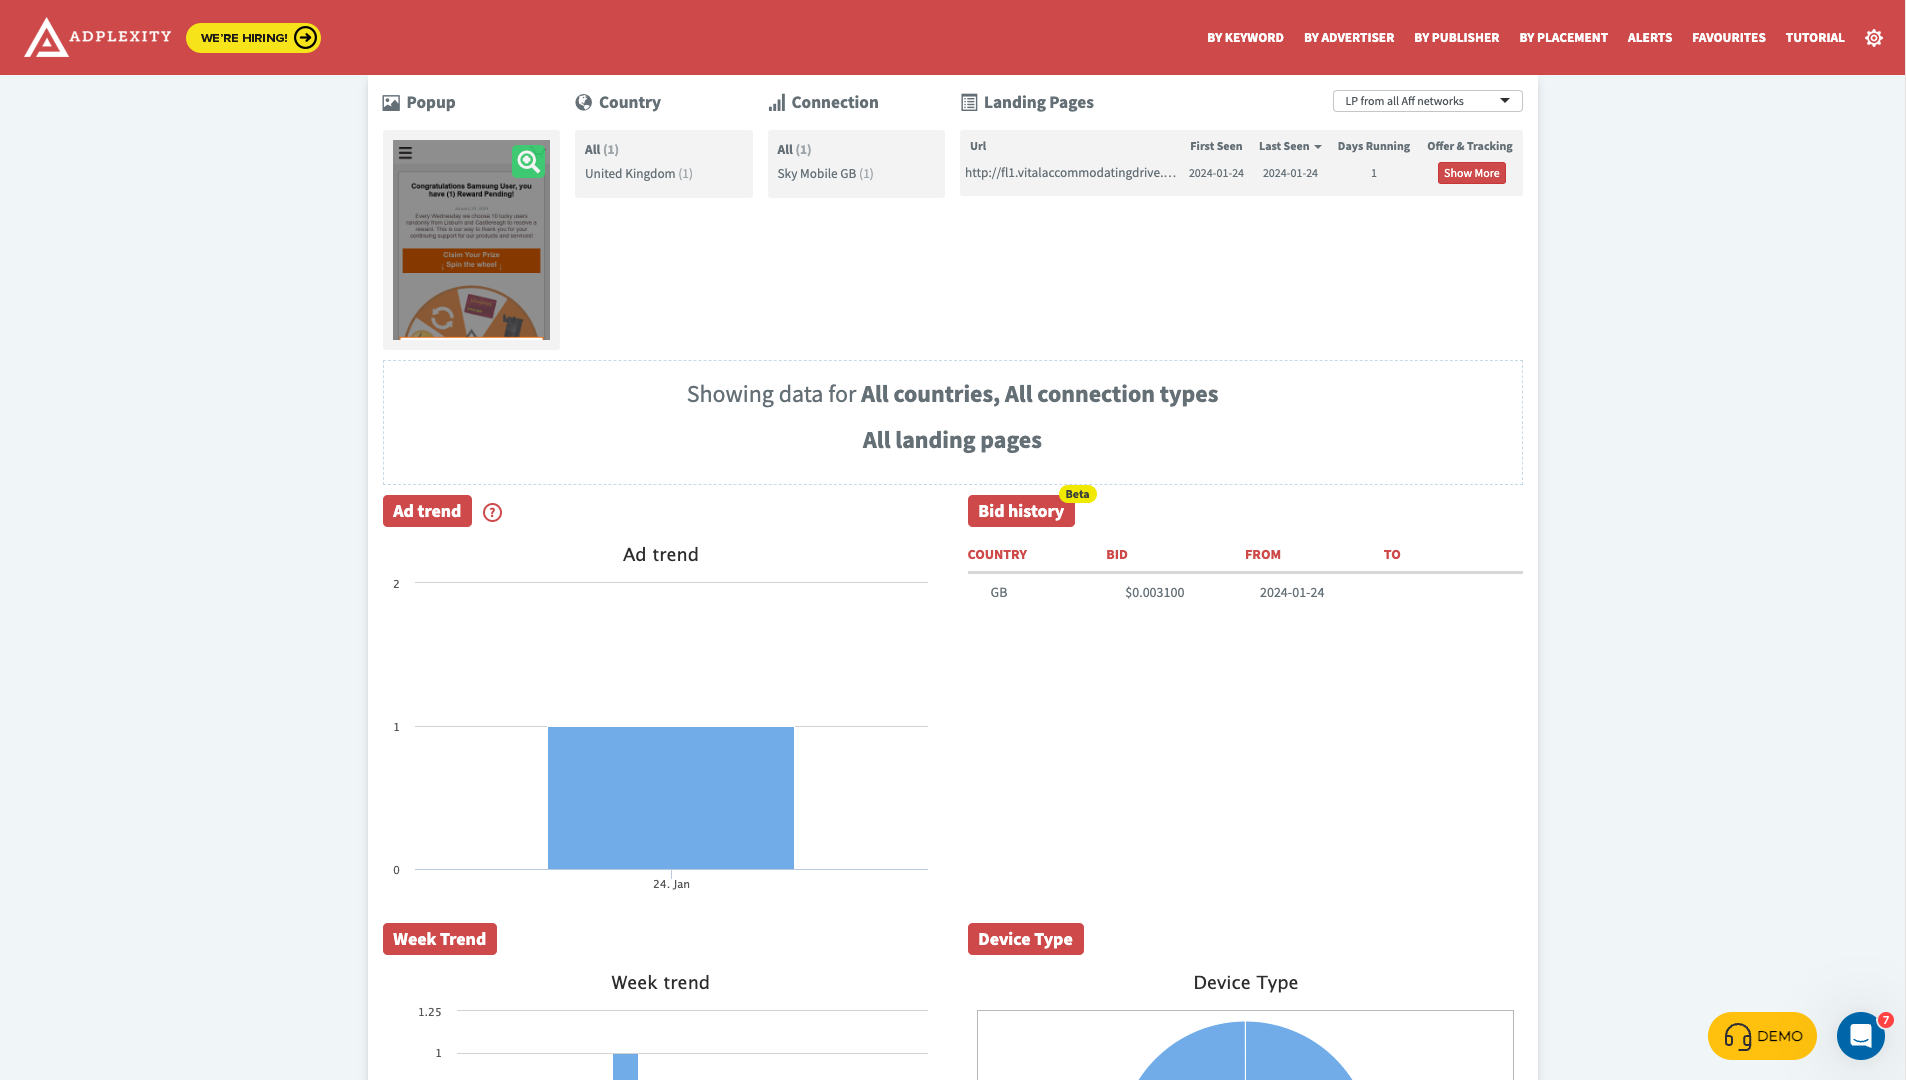
Bid History
The CPC bid history table in AdPlexity Mobile gives you valuable intel into your competitors' bidding strategies over time. You see the countries they target, the bid amounts they use, and the date ranges those bids were in effect.
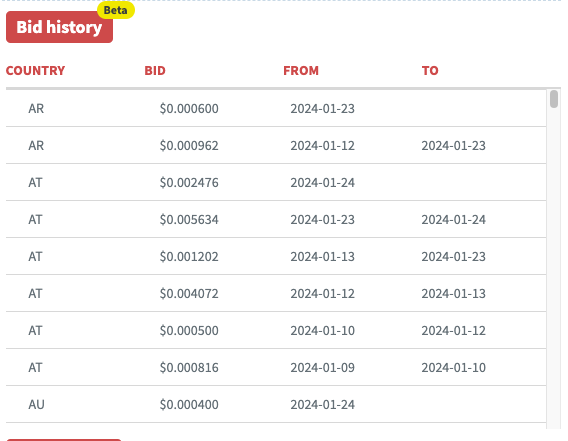
With this data, you can align your bids to be just above theirs, to beat them on the auction. Or you can go below if you want to be the low-cost leader. Having the country info helps you focus bids by geography to maximize profits.
Knowing historical bid changes is useful to predict seasonal shifts. Bids often drop in December and January as budgets deplete. February/March see jumps as budgets renew. You can optimize bids up or down accordingly.
The CPC history widget lets you mimic winning bid patterns. See what high-traffic countries and bid levels earn clicks. Apply those insights to your campaigns.
Week Trends
The Week Trend bar chart in AdPlexity Mobile shows you the number of times your competitors' ads appeared each day of the week. This helps you spot patterns and trends.
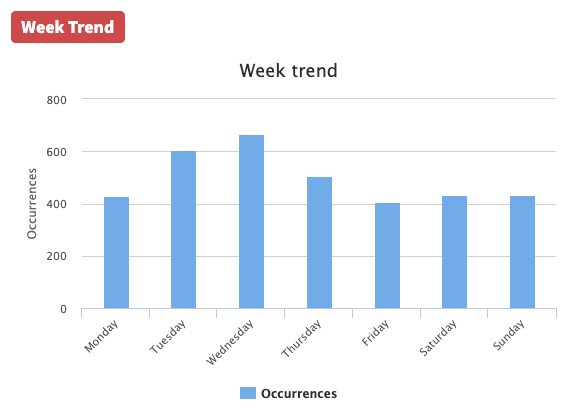
You can use this to plan when to run your own ads. For example, if you see lots of competitor ads on Wednesdays and Thursdays, you may want to run ads more heavily on Tuesdays to get ahead.
Or if Fridays have fewer ads, that day could be an opportunity for you to stand out from the competition.
Checking the Week Trend bar often lets you adjust your budget day by day. You can spend less on days when competitors advertise more. And pour more budget into the light ad days. This helps stretch your dollars further.
The Week Trend chart is a key tool to outsmart the competition with AdPlexity Mobile. Use it to spot openings and fine tune daily ad plans. This can increase conversions at the lowest cost.
Device Type
The Device Type pie chart in AdPlexity Mobile provides a quick, visual breakdown of the mobile device types being used by your competitors' target audience. As an affiliate marketer, this insight allows you to optimize your own campaigns more effectively.
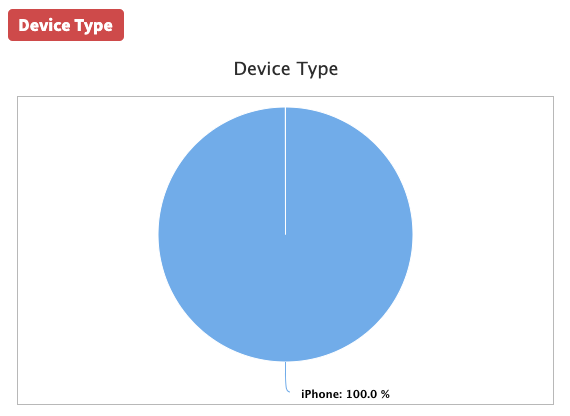
For example, if you see a greater slice of the pie is made up by iPhone users, you know to focus your efforts more on iOS-optimized sites and ads. You can create mobile landing pages formatted for the iPhone screen size and dimensions. And you can ensure any creatives, like banners or interstitials, render properly on iOS devices.
Similarly, if Android has a significantly larger share, that becomes your primary focus. Create landing pages and ad units tailored specifically for the Android platform.
Having this Device Type pie chart readily available saves you time having to dig into audience data across multiple sources. With a quick glance, you instantly know which mobile platform requires greater attention. This allows you to maximize conversions, revenue, and return on ad spend when promoting offers to your competitor's mobile users.
Publishers By Duration
The Publishers By Duration bar chart shows you exactly how long each traffic source has been running ads on specific publisher domains. You can clearly see when a competitor started a new campaign or added a new publisher.
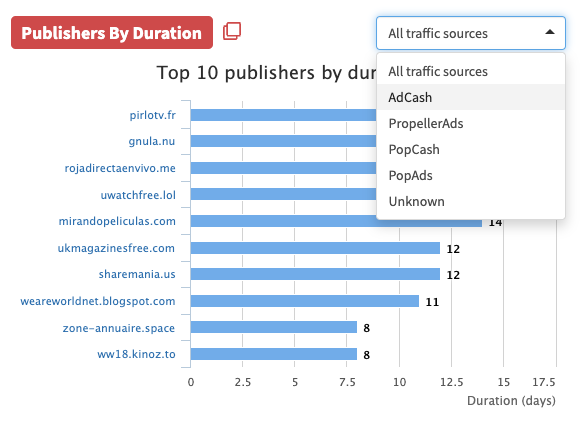
This allows you to quickly spy on any new publishers your rivals are testing. As soon as you spot a new domain, you can try it out yourself to see if it converts. No more guessing which sites your competition is using.
The chart also shows when publishers go inactive. If you see a domain drop off, you know that publisher stopped working. You can pause your own campaigns on that site to preserve profits.
By closely tracking your competitor's publishers and how long they run ads on each domain, you can model what works and instantly spot any promising new publishers to test. The Publishers By Duration chart gives you an informational edge to stay ahead.
Publishers By Volume
The "Publishers By Volume" pie chart in AdPlexity Mobile allows you to easily see the top publishing domains driving traffic for specific traffic sources. By applying a filter for AdCash, PropellerAds, PopCash, and PopAds, you can analyze the top publishers generating volume across these major mobile pop traffic sources.
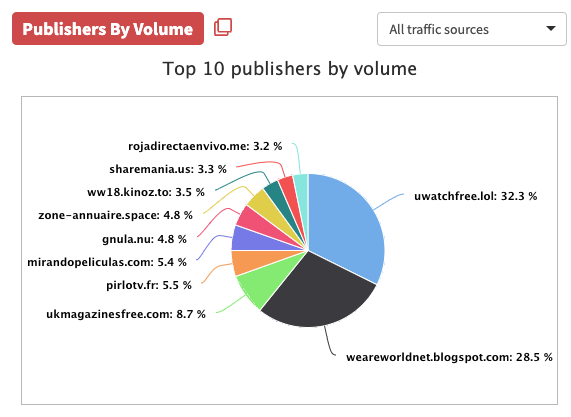
This data is extremely valuable if you are an affiliate looking to spy on competitor landing pages and offers. You can see exactly which publishers and domains your competitors are using to drive traffic for mobile pops. Then you can try to replicate their success by promoting the same offers, or promote directly to the same publishers they are working with.
The pie chart makes it simple to visualize the publisher breakdown at a glance. You can instantly spot the top 1-2 publishers dominating volume for these traffic sources. Focus on replicating what the top publishers are doing right to send more mobile traffic. Having this competitor intelligence allows you to make smarter decisions about which offers to promote and better inform your mobile pop traffic strategy.
Publisher Placement IDs By Duration
The "Publisher Placement IDs By Duration" bar chart shows you which mobile ad placements are earning the most money over time. You see exactly how many clicks or signups each ad spot gets per day.
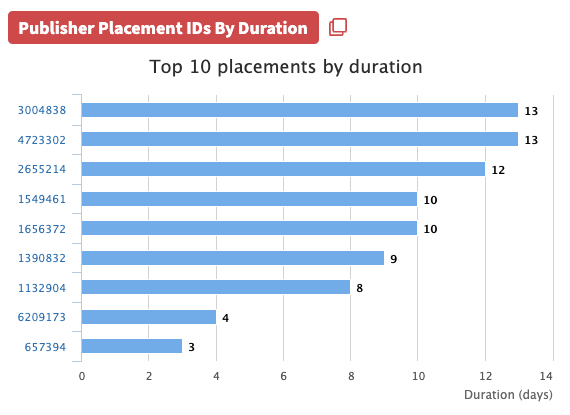
This helps you laser focus on the top converting mobile ad networks. Stop guessing and see accurate real-time data.
For example, you may spot mobile ad placement ID 14589 consistently driving sales every day for the past 2 weeks. That's a hot lead to investigate closer.
Or you notice placement ID 96318 had great results for 5 days. Then it tanked. You can dig into the details and optimization opportunities.
Publisher Placement IDs By Volume
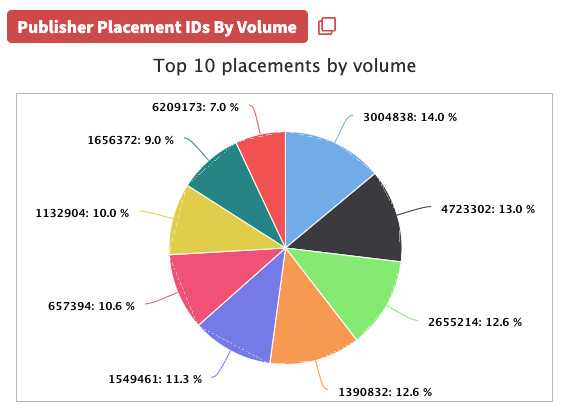
The "Publisher Placement IDs By Volume" pie chart in AdPlexity Mobile allows you to easily see the top placement IDs driving volume for a competitor's mobile ad campaign. As an affiliate marketer, this chart gives you valuable intelligence to find profitable placements to send your own traffic to.
You can use the pie chart to identify the biggest placement IDs by volume that your competitor is getting clicks from. Then you can try sending your own traffic to those same placements through various mobile traffic sources like mobile pops or redirects. This allows you to capitalize on placements that already convert well for mobile ads.
The chart also shows you smaller placement IDs that may be untapped opportunities. You can test sending traffic to some of the smaller slices of the pie to find viable placements that your competitor may not be fully taking advantage of yet.
Traffic Sources By Duration
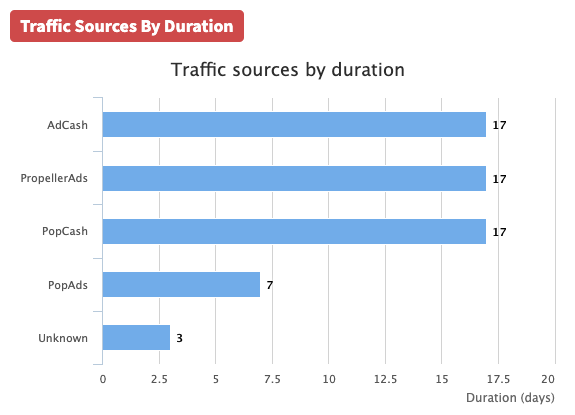
The "Traffic Sources By Duration" bar chart in AdPlexity Mobile allows you to easily see how long traffic from different sources is staying on your mobile ads and landing pages. This helps you identify the best performing traffic sources that result in more engaged visitors who spend more time interacting with your offers.
For example, the chart may show that PopCash traffic tends to bounce very quickly, while AdCash visitors have much longer average visit durations. This indicates that AdCash seems to be a better source for sending targeted, interested traffic. You would want to allocate more of your ad budget to AdCash rather than PopCash.
By analyzing the duration metrics across traffic sources, you can optimize your mobile campaigns by focusing your efforts on the sources driving the most committed visitors over time. This helps improve conversions and return on ad spend. The visual chart makes it quick and easy to spot the best and worst performers.
Traffic Sources By Volume
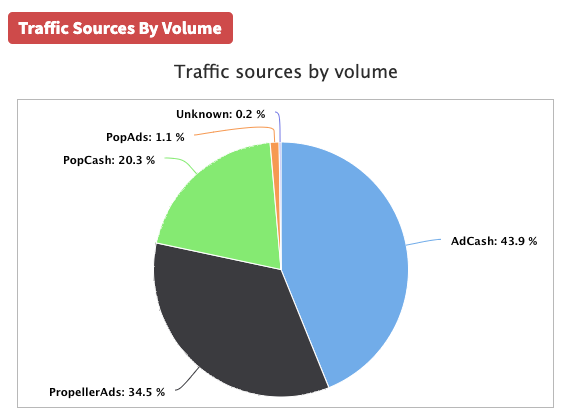
The "Traffic Sources By Volume" pie chart in AdPlexity Mobile allows you to easily see the percentage of traffic volume generated by each traffic source. As an affiliate marketer, this chart enables you to optimize your mobile campaigns by focusing your efforts on the highest volume sources.
For example, if you see that AdCash drives 30% of your traffic volume while PopAds drives just 10%, you can allocate more of your ad budget to AdCash or try to improve your PopAds performance. Monitoring this chart over time is also useful to spot rising or declining traffic sources quickly.
Overall, keeping an eye on the "Traffic Sources By Volume" pie chart will ensure you always emphasize your top publishers and make changes to underperformers, maximizing the volume of mobile pops and redirects hitting your offers. This will translate to more conversions and higher earnings across your mobile campaigns.
Country & Connection
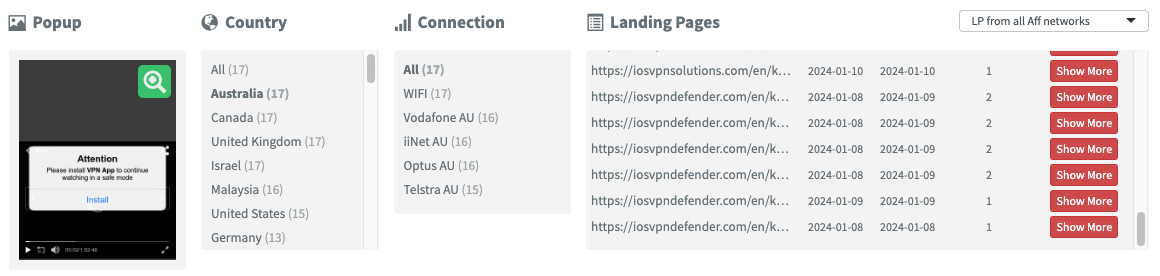
You can filter by Country and Connection and then all the data widgets will update according to your filters.
Conclusion
Continue exploring other AdPlexity products:
- AdPlexity Mobile
- AdPlexity Desktop
- AdPlexity Push
- AdPlexity Native
- AdPlexity Adult
AdPlexity Mobile Coupon Details
| Website | https://adplexity.com |
| Primary Category | Spy Tools |
| Monthly visits | 10K |
| Affiliate Program | Available |
| Active Coupons/Promotions | 1 |
| Promotion Code | AC25 (25% off) |
| Coupon Code Stacks on Yearly Discount | Yes |
| Socials |
Screenshot of AdPlexity Mobile

AdPlexity Mobile Alternatives
1. AdPlexity Mobile vs Anstrex Pops

Loading comments....